Enterprise UX · Knowledge graphs
Knowledge Explorer
From a symptom to a related fix.
Illustrative reconstruction with fictional content.
I designed a search and browsing experience for people solving technical problems and the people who maintain the knowledge they rely on.
A graph with no obvious starting point
The graph already linked products, parts, issues, tasks, and help articles. The people troubleshooting needed a way to start with a symptom and find the relevant answer. Knowledge maintainers needed to inspect the records, their properties, and where they fit in the hierarchy.
Requirements changed while I was designing. I used each round to put a concrete choice in front of product and engineering. As the data model grew from three entity types to seven, I kept the way people searched and read results consistent.
- Design iterations
- 15
- Navigation models
- 3
- Entity types
- 3 to 7
Put the whole question in one field
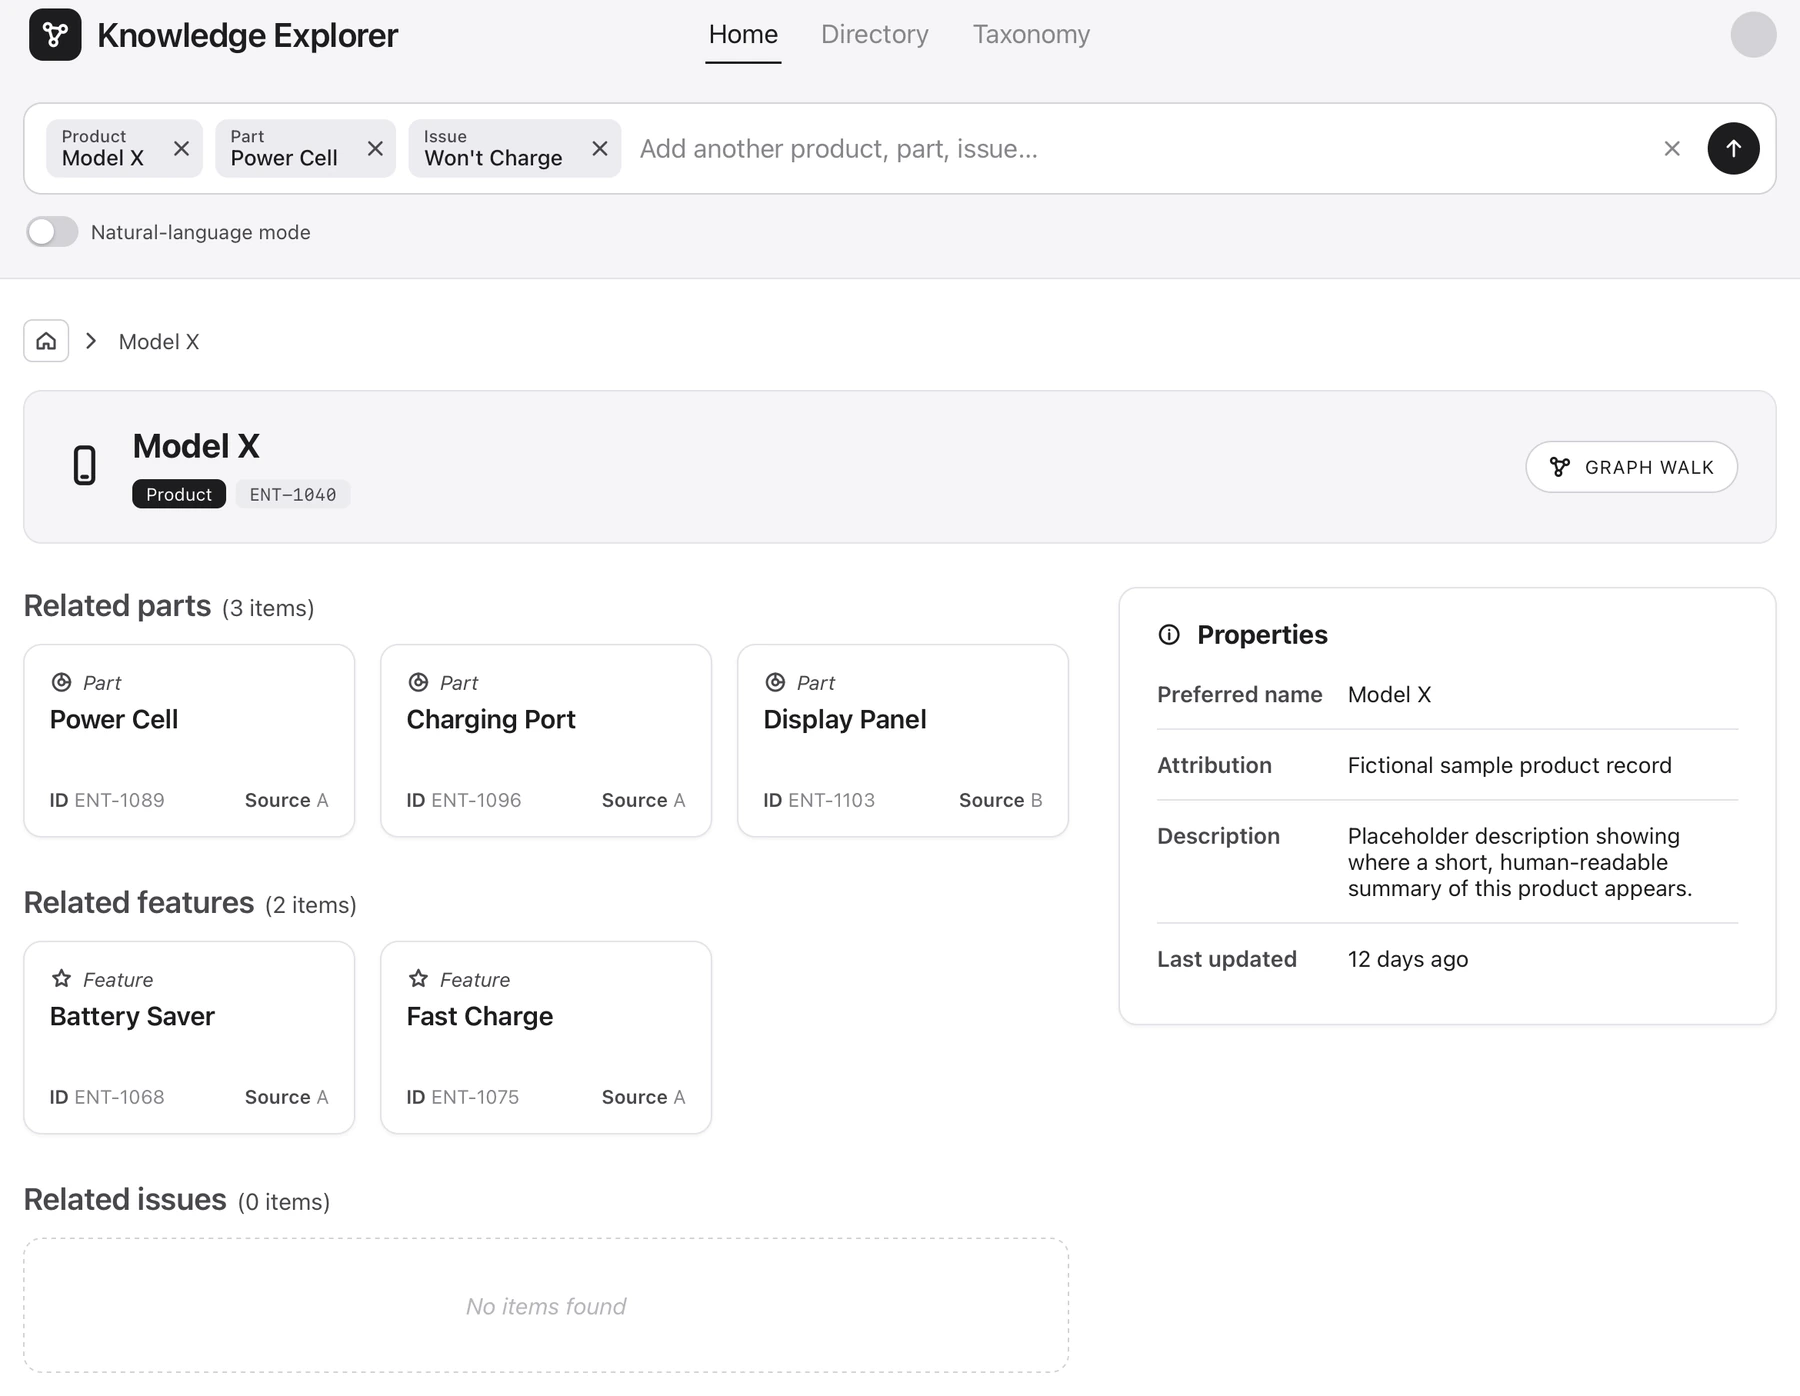
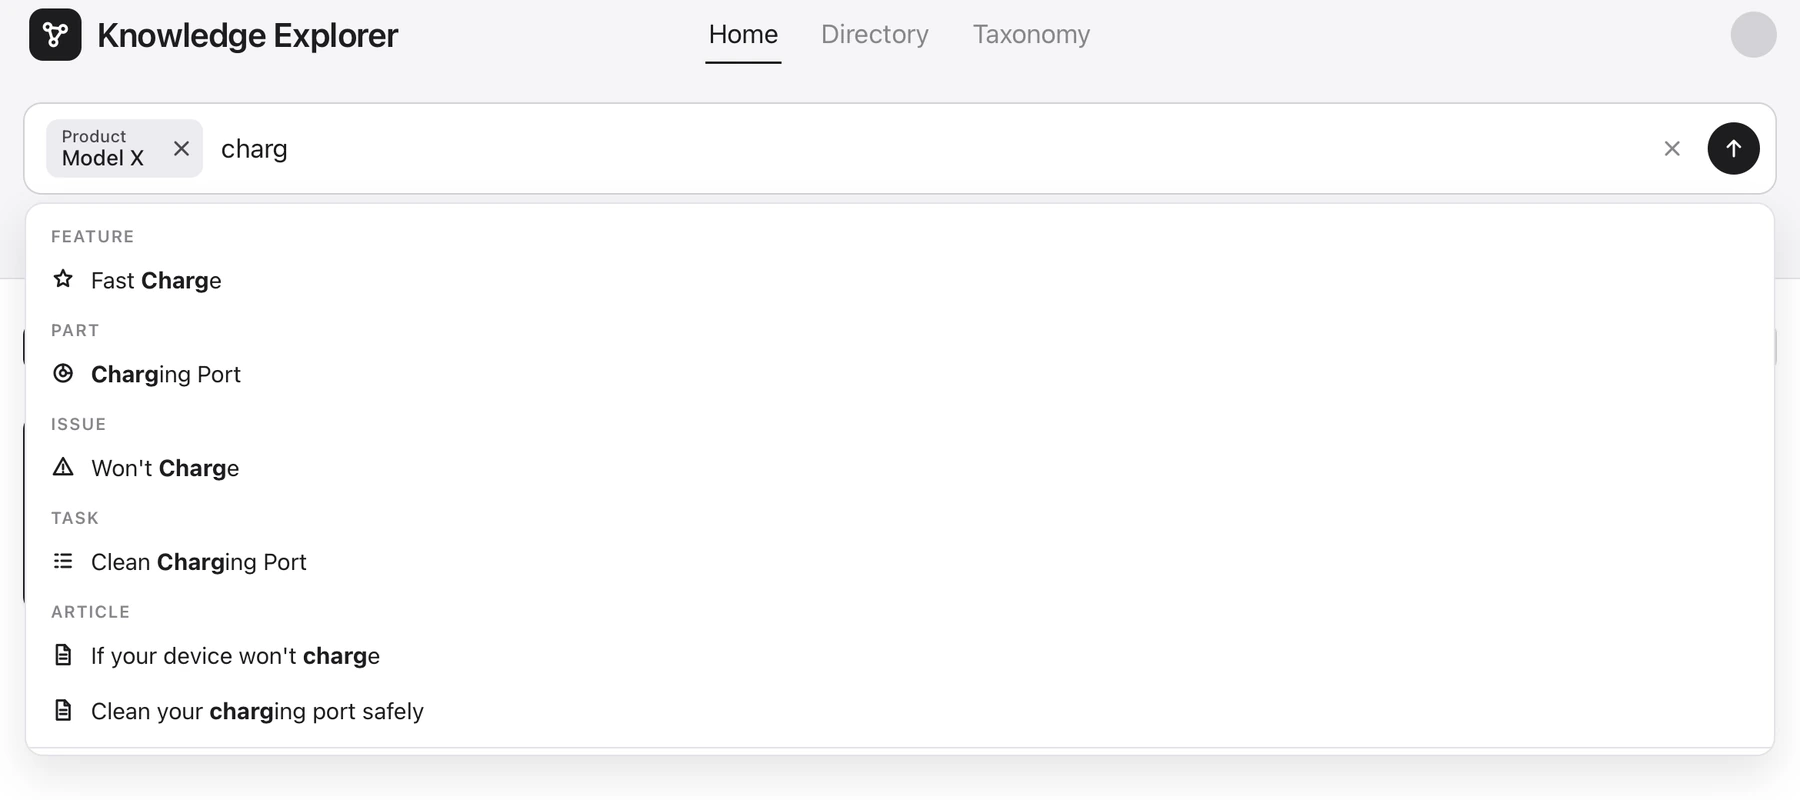
My first concept split a question between a chat prompt and separate fields for product, symptom, and task. I merged them into one field. Suggestions appear by type, so people can tell a part from an issue before adding it to the query.
Every selection becomes a labelled token that people can remove. This let me add new entity types without changing how someone searches. I kept an explicit natural-language mode for questions that are hard to express with tokens.
Illustrative walkthrough
A Model X won’t charge
A support engineer starts with the product and symptom, then follows the issue to a repair task.
Start with Model X. Typing “charg” brings up matches by type. Pick “Won’t Charge” as the issue and add Power Cell as the part.
Show relationships before opening the graph
I tried a relationships table first. It listed connected records but hid the paths between them. I put related items in counted groups on each record, with properties to the side. Graph walk is a separate action for following a specific connection.
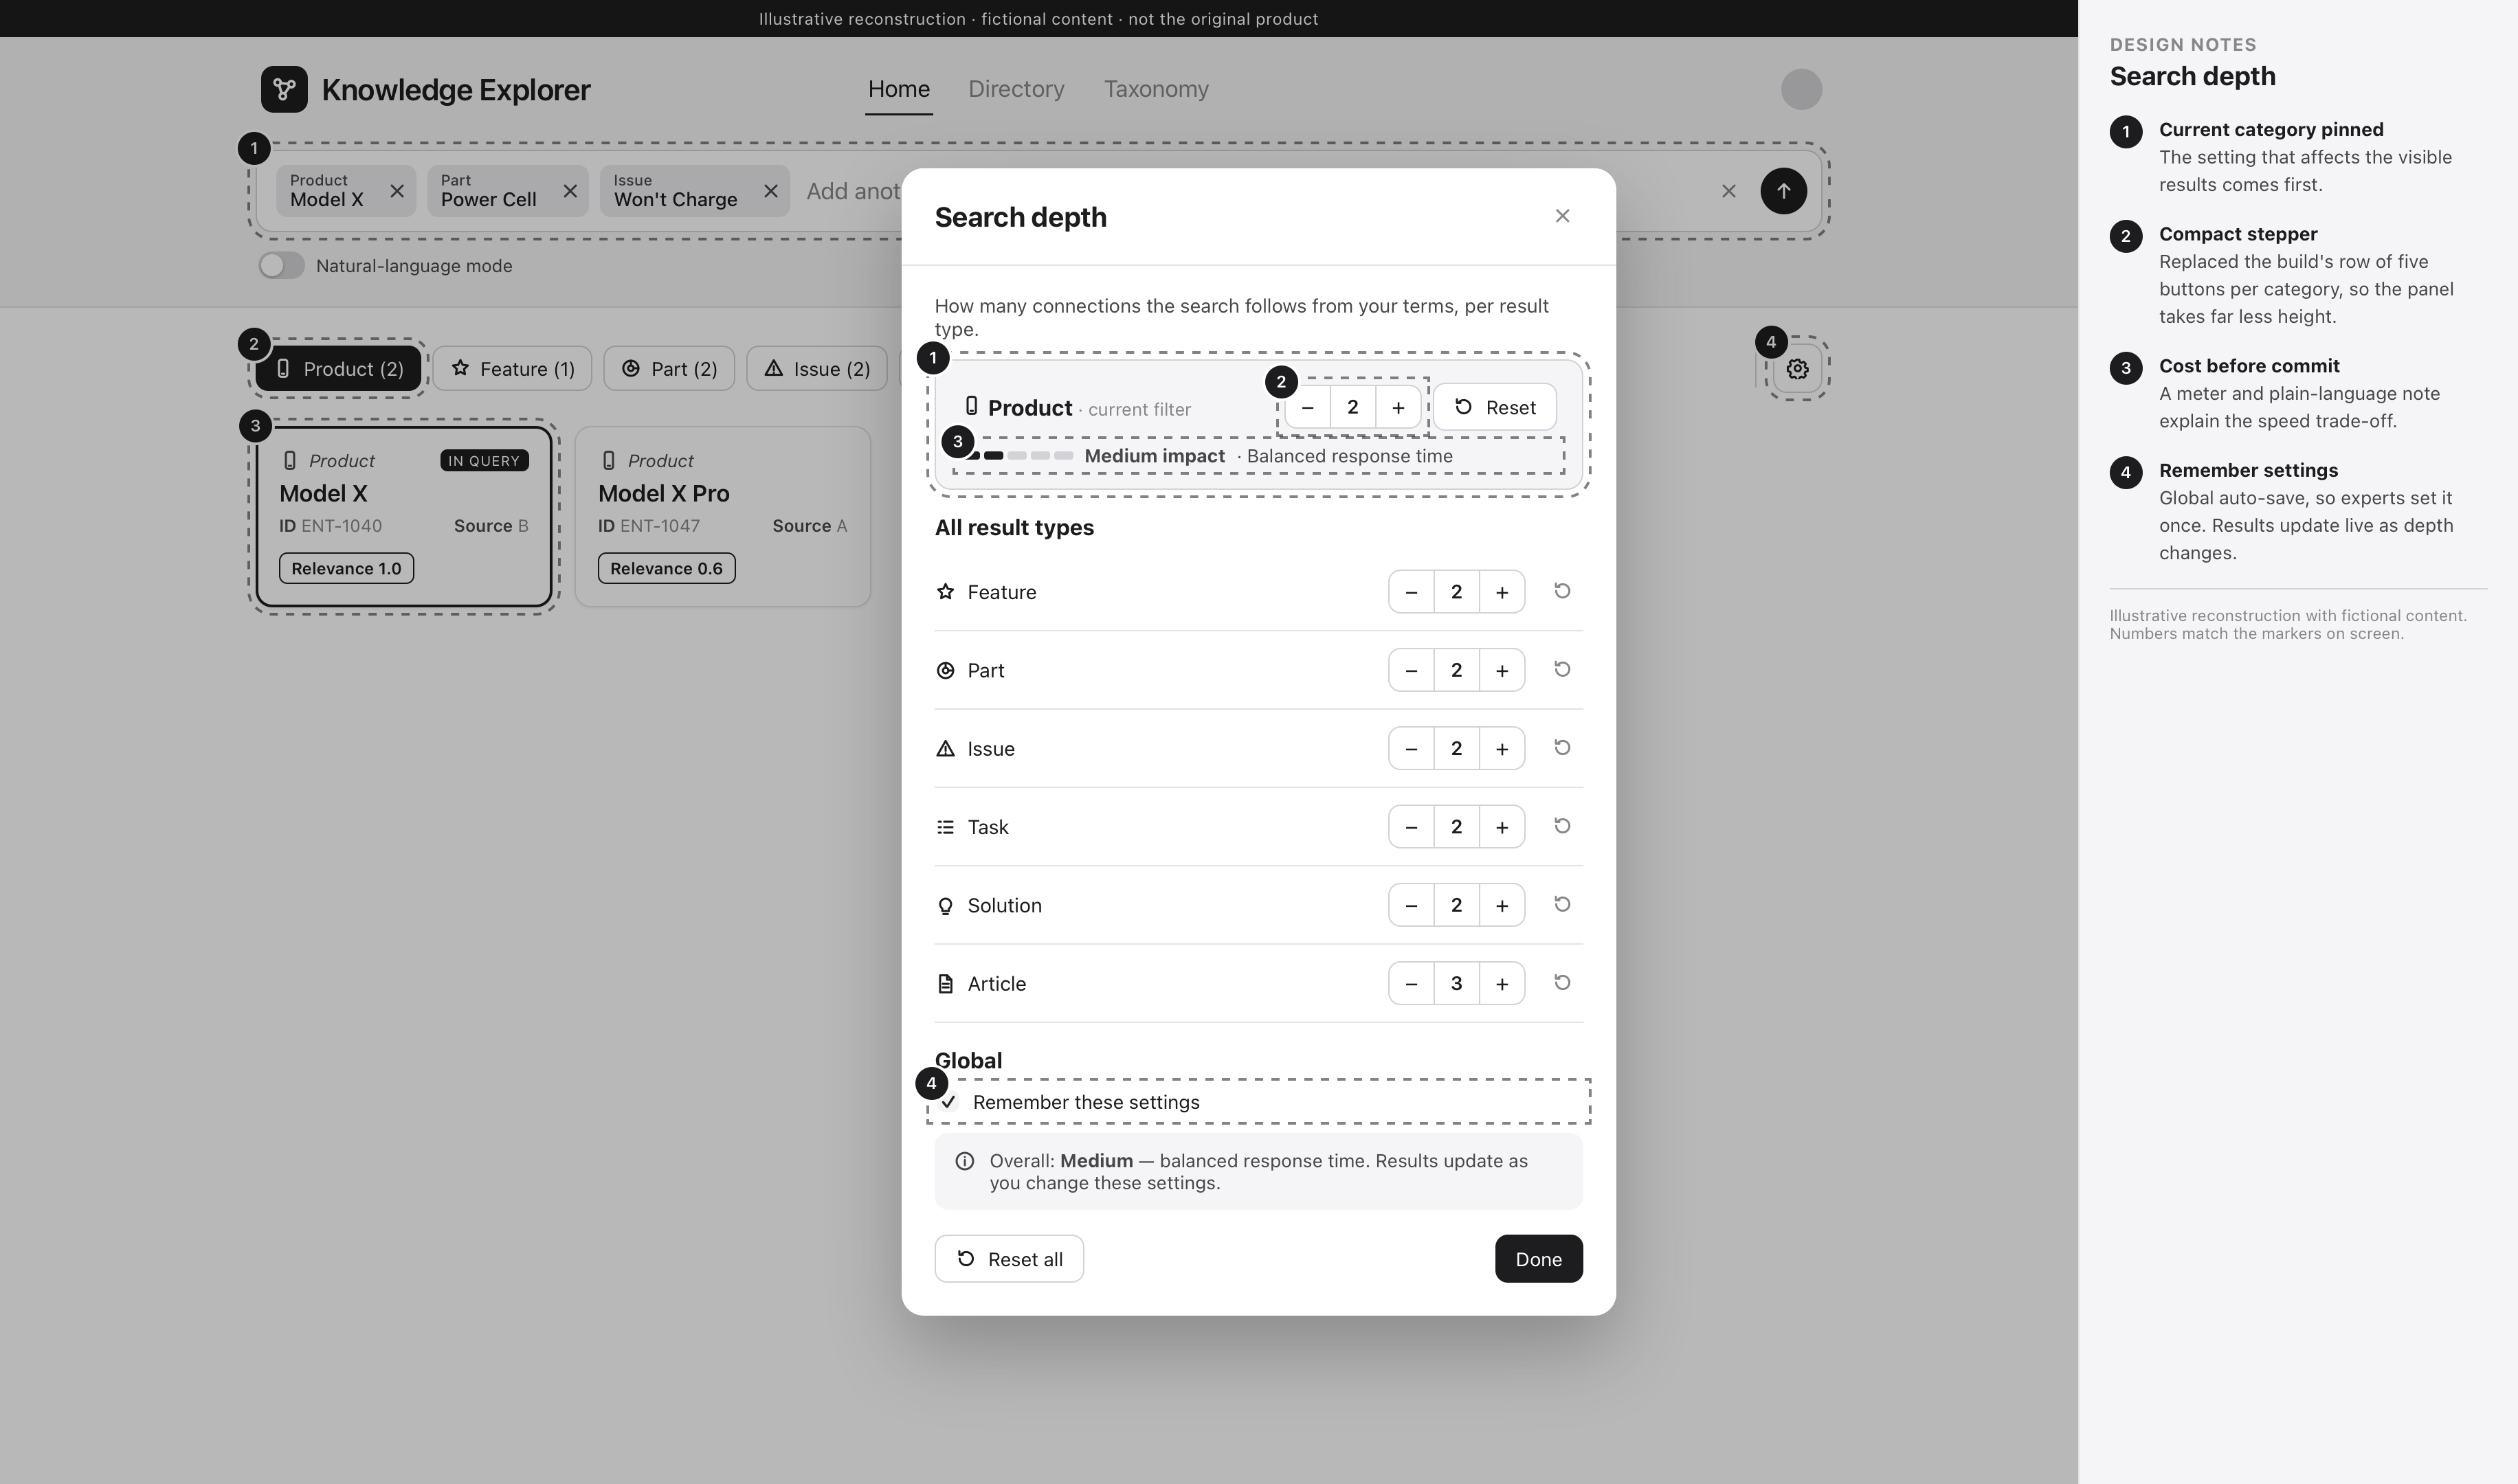
People can adjust how far the search follows links for each entity type. The depth panel explains the response-time cost so they can decide when the extra results are worth the wait.
Adjusting search depth by entity type
Keep the building blocks stable
Navigation went through three models. I kept the query tokens, result cards, and relationship groups consistent so I could reuse them as the destinations changed.
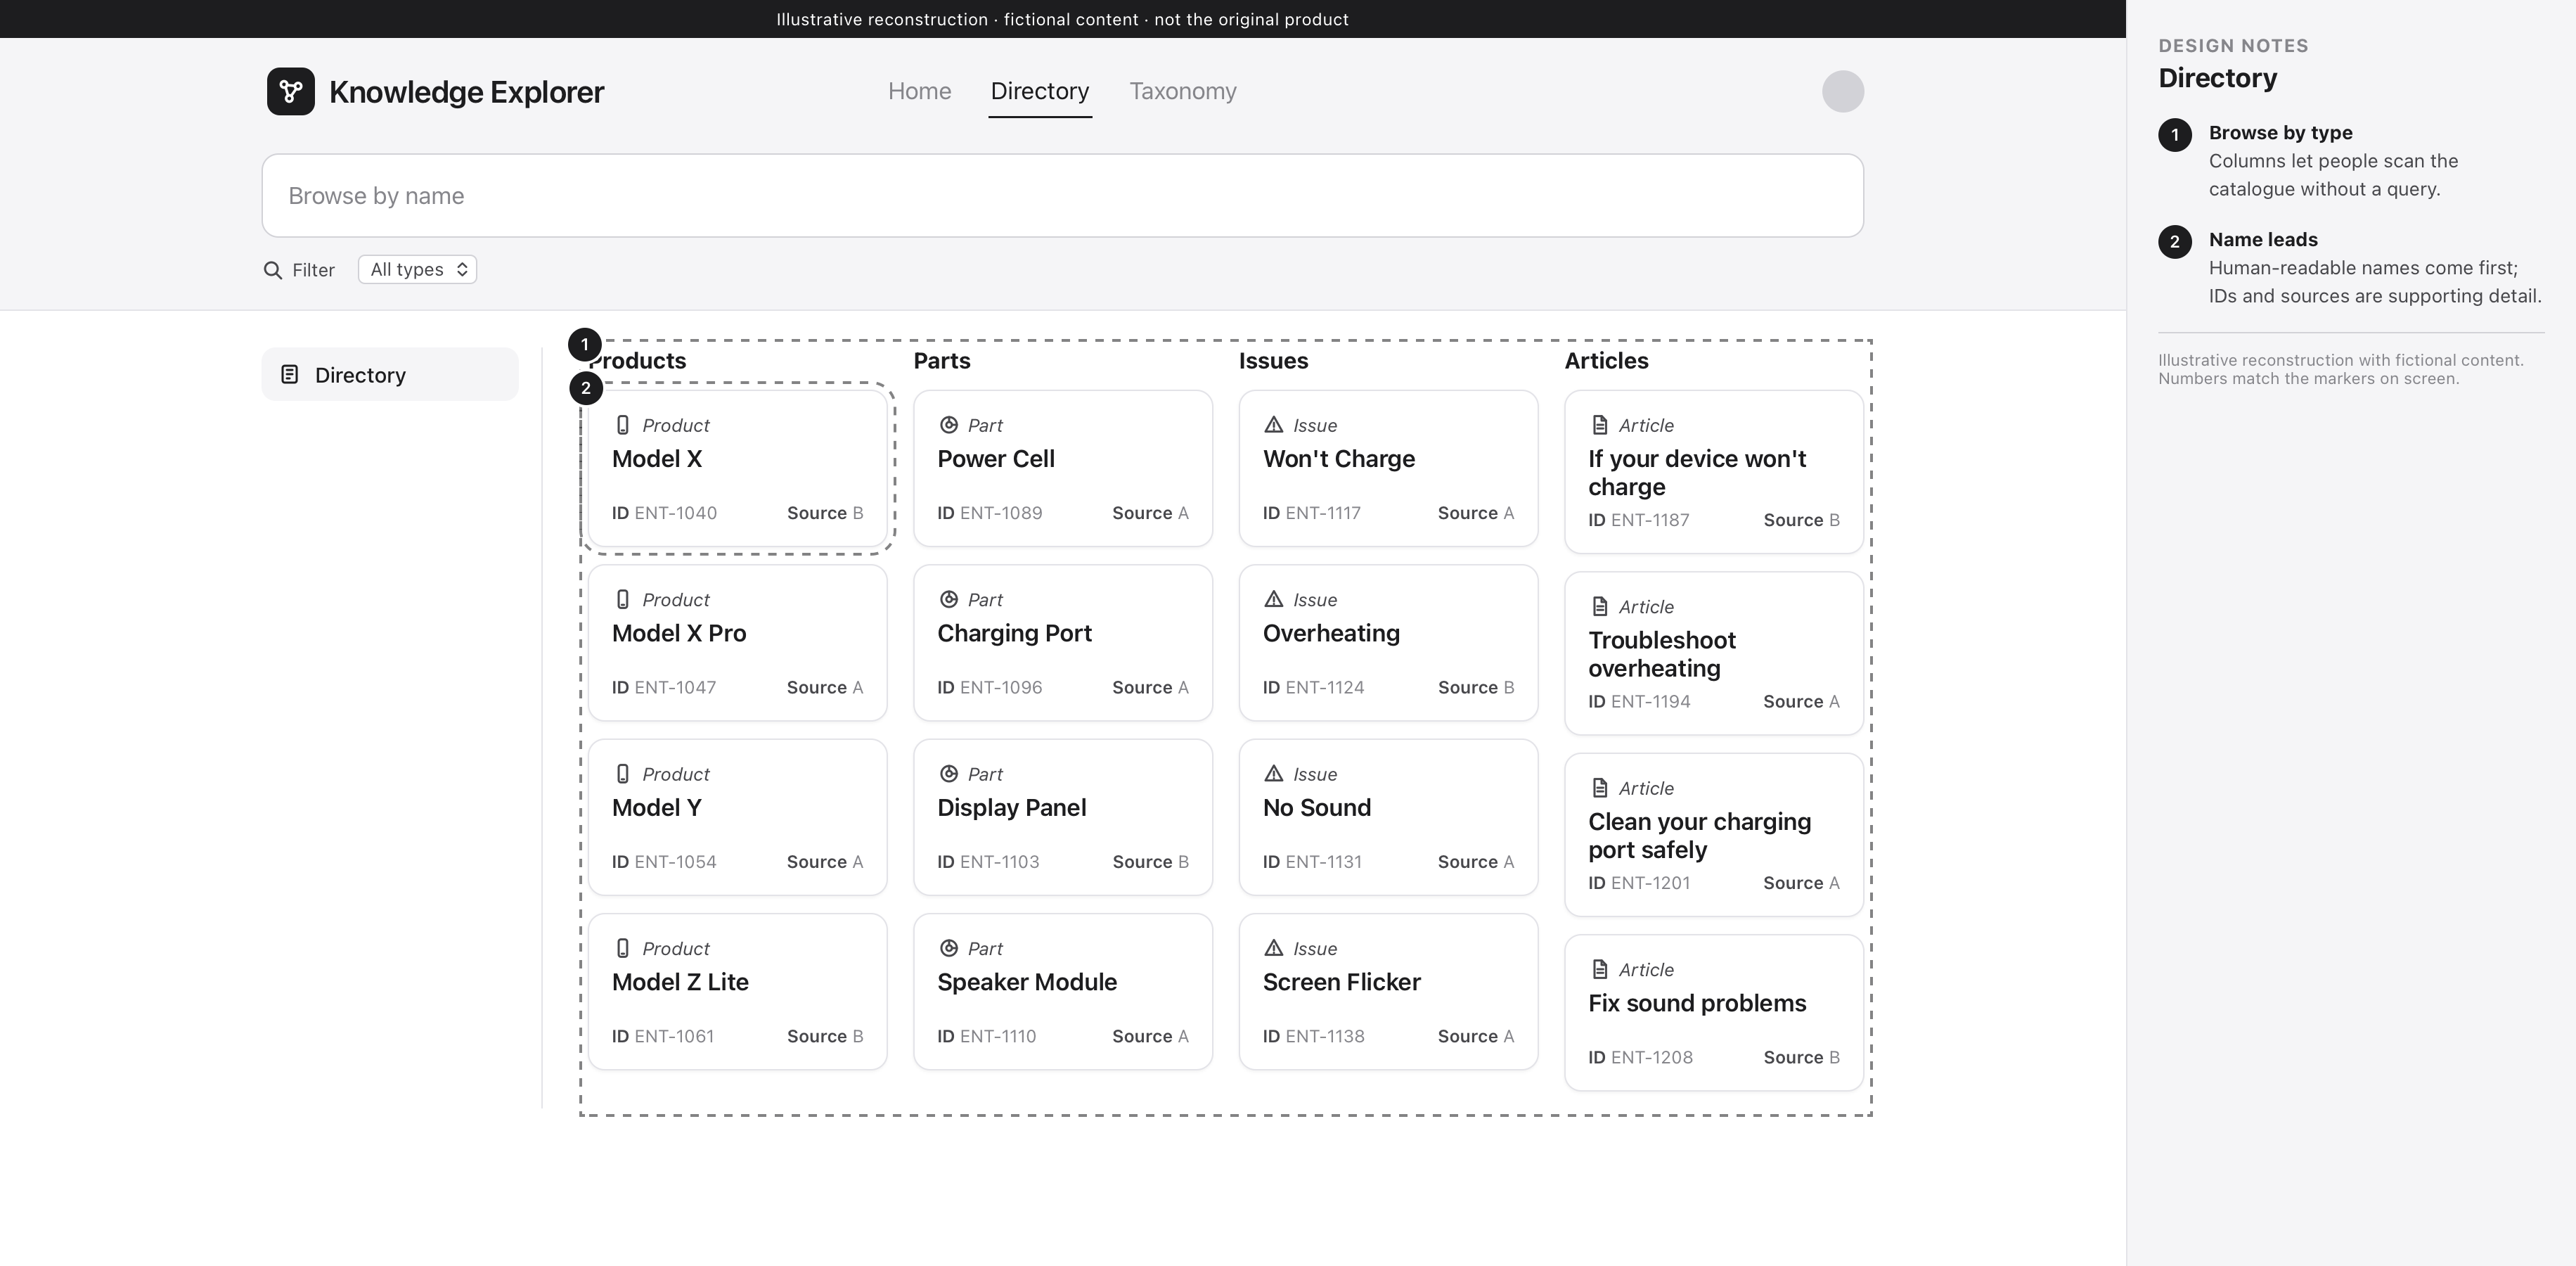
Home starts with a question. Directory is for browsing by type, and Taxonomy shows how categories fit together. I also explored a side panel and a side-by-side comparison. The comparison dropped out as priorities changed.
Refine what people read first
I reviewed the working build screen by screen and focused the final design set on the issues that affected reading and navigation. Cards now put the name ahead of IDs and sources. Tokens and filters use readable type labels, and empty states share one pattern.
I also replaced long rows of depth buttons with steppers and pinned the active category at the top. That keeps the current setting and its reset within reach.
Card hierarchy
Type and name come first. Source, ID, and relevance each have a consistent place.
Empty and zero states
Type filters show counts including zero. Empty views give a clear explanation in the same format.
What went into the build
Engineering implemented the final design set. The token, card, and relationship patterns carried through all three navigation models. I delivered inspectable specs and used the working build to check where those patterns needed refinement.
My design scope covered how people see what the system understood, what matched, and where to look next. Retrieval and scoring were part of the underlying platform.
What I would test next
Showing a working direction in each round helped the team settle questions about the brief. Next time, I’d agree on a review cadence with engineering sooner and test token search and depth controls with the people who use them.